Coding · June 2026
Automated Controlling Dashboard for a Poliklinik
- Excel
- Power Query
- PivotTables
- PivotCharts
- DAX
- SAP
Role: Data Modeling · Dashboard Design
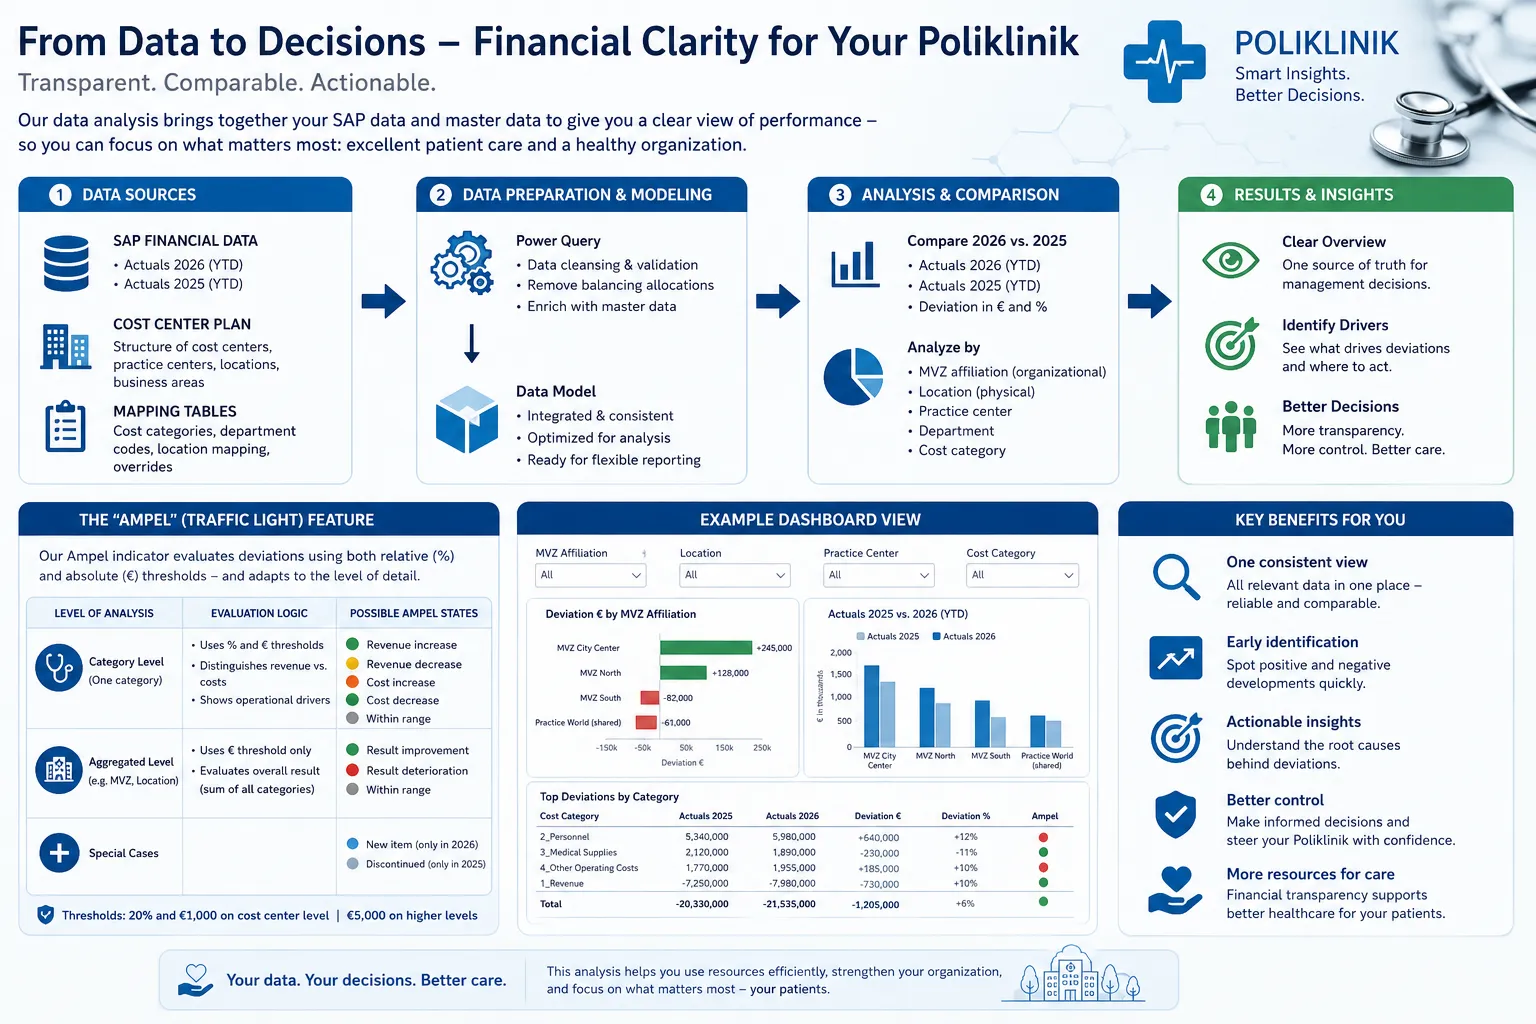
An automated Excel-based dashboard for management and controlling that consolidates SAP raw data, cost center plans and mapping tables into an interactive view. Built with Power Query for data transformation and enrichment, PivotTables, slicers and DAX measures, it supports drill-down analysis by MVZ, physical location, practice center, department and category. Custom traffic-light variance logic highlights budget deviations—distinguishing cost increases, revenue changes and result improvements or deteriorations—at both detailed cost-center level and aggregated management views.